You're forgetting to adjust for inflation. The 1927 bubble - adjusted for inflation - took closer to the late 1990s to get a reasonable return (when you were going into the second biggest bubble of all time). Nearly every investor would've died by then.
Adjusting for inflation using shadow stats, you'd still have lost money.
With the Florida land bubble - you're also forgetting property taxes.
>Adjusting for inflation using shadow stats, you'd still have lost money.
That's because shadow stats is a joke. If you adjust US GDP using their inflation figures, you'd find that the US economy has been on a continual decline for the past few decades.
> That's because shadow stats is a joke. If you adjust US GDP using their inflation figures, you'd find that the US economy has been on a continual decline for the past few decades.
Today families need dual incomes just to purchase a modest home and carry health insurance. How is this not a decline in standard of living from a few decades ago?
Where's our new airports? New rail transit systems? New infrastructure? Everything in this country is old and getting older.
Inflation is and always will be relative value story. Some airports are crumbling, some are newer. Today we have iPhone's, virtual doctor's appointments and no horse manure in the street.
And 40 years ago we had real doctors actually available for patients, no horse manure in the street, and no capitalist manure wired into our pockets 24/7 controlling our information flow thru a select set of international media conglomerates.
I’m skeptical that the things you don’t like about 2022 are because 1982 was strictly better. Seems much more likely that we simply have a different set of compromises and priorities, with some things better and some things worse and no easy way to untangle the complex interdependencies into sweeping linear statements like “decline”.
Who are you talking to? When did I make any statements of that nature?
I was pointing out the provided example was stupid. Smart phones are "cool" and all, but it'd be a tough sell to argue successfully that connectivity has increased societal cohesion, education, information dispersal, or any of the other virtues you might hope for.
Instead, iPhones and virtual doctor appointments are like bandaids on a societal-wide decline, where increased privatization combines with government inflation to create a caste system they disguise as capitalism. Inflation-adjusted salaries are lower than ever across the board, housing prices are skyrocketing both absolutely and as a function of salary-years, corporate control of information has reached unprecedented levels, and the "relative value story" of now vs 40 years ago makes it pretty clear it's tougher to have a good life now even if you can have fancy toys to interact with corporate-controlled data-mined ad-laced entertainment
I’m responding to the thread. Decline is mentioned a few posts up. Regardless of all the bad things you list, I would still prefer to live in 2022 than 1982 because I believe those bad things are stated hyperbolically and where there are genuine negatives they are more than compensated for by other factors. Are things perfect? No, let’s keep working on this and make 2062 even better.
> Are things perfect? No, let’s keep working on this and make 2062 even better
The naivety is almost making me feel better, but I don't think you understand what capitalism has done to our world's power structures if you think we stand a chance to change anything
Problem is that wages did not increase with economic growth. Those that benefit the most are a small minority, so yes, now both parents would need to work to achieve the same.
Originally, my plan was to earn enough to secure a house & future as a working person, and then try to join politic and change the discourse.
Now, my plan is to accept that even with a good salary securing a future at good QOL costs a lifetime, so I will try to enjoy myself and hopefully buy a home that doesn't get burnt down in the increasingly frequent and devastating forest fires of my native home.
> you'd find that the US economy has been on a continual decline for the past few decades.
That claim sounds reasonable given what I've observed happening in this country over the last few decades. Without question people seem to struggle much more to obtain the same level of lifestyle as many enjoyed decades ago.
You seem to claim that this is such an obvious falsehood that there's no more room for discussion, but I think there's much more room for discussion that you are implying.
When you say that you've observed what has happened over multiple decades, are you observing people within your own social circle and are those people from a diverse and representative background or are they from a narrow demographic? It's true that the relative economic status of white men has declined over the last few decades, but the economic status of women or men from other ethnic groups has grown significantly in that time.
And even then your premise is still largely false. The median and average economic outcome of white men has increased perfectly reasonably since the late 1970s. That includes both income and net wealth figures. The American white male is economically better off than the white male in: Britain, Sweden, Germany, France, Spain, Italy, and so on.
It's primarily the labor-heavy working-class white male (in the white male demographic) that has been brutalized by changes in the US and global economy. They have been left behind to drown in a pool of fentanyl.
> It's primarily the labor-heavy working-class white male (in the white male demographic) that has been brutalized by changes in the US and global economy. They have been left behind to drown in a pool of fentanyl.
That sounds like most people are actually more negatively affected by the economy compared to decades prior.
No, not "most". It's 30% or 40% of people. That's not "most". In particular, it's not enough to dominate the statistics.
Let me say very clearly: It's far too many people. I don't care if it's less than a majority, and I don't care if it swings the overall statistics. It's still too many people that are being economically destroyed.
I love hacker news, complaining about semantics when someone says most people are having their lives ruined with the clap back that it's only 40% is the best possible reply!
Most people merely struggle to pay rent which is fueled by insane zoning which people use as a cudgel to beat other residents up to get them to pay up insane prices for housing.
Outside of housing everything is dirt cheap nowadays.
> Based on my conversations with Williams, I think I now understand what he’s doing: he’s misinterpreting a cumulative 20-year change in the measured price level as a change in the measured annual inflation rate. And that caused him to overestimate that annual change by at least an order of magnitude.
Looking around that makes sense. Actual production shrank and almost no one can afford housing until they're middle aged. Walking down city streets the buildings that aren't boarded up and decaying only have "for lease" signs in the windows.
> and almost no one can afford housing until they're middle aged
...except that shadowstat's inflation figures outstrips even housing prices[1]. Eyeballing their chart, we've been experiencing 9% growth between 2000 and 2020, translating to a 460% increase. By comparison the housing price index has only gone up 184%
the US economy has been on a continual decline for the last few decades, it's jsut been cleverely masked.
that sounds quite reasonable to me, considering the vast decrease in material living standard in the US for the last several decades. there was an interview with someone who lived through the 70s that was saying a painter back then could afford to buy his own home, have a wife that didn't work and six kids! today, a single painter can barely afford to rent a single bedroom, let alone support a whole family and have a house.
Not just that, but our lifestyles have changed entirely. How many outfits did people own? How many cars? How often did they eat out? What kind of entertainment did they enjoy, and how often?
People could generally meet their basic needs because those were the only things they spent money on. Life was exceedingly bare-bones. Houses were small. Your life revolved around your job. You cooked all your own meals. You entertained yourself. The list goes on.
All of that said, house prices are alone just bad example. If you went somewhere with cheap land and no red tape, you could get a 70's house at 70's prices (adjusted for inflation) still.
I watched "Apollo 10 1/2" recently. It's about what life in America was like in the late 1960s.
One thing is that mom cooked all the meals. People rarely ate out. I know that was true in my family at the time. Eating out was a major, major treat. Entertainment was going out the door and joining up with the neighborhood kids. The house was tiny.
People rarely ate out because most people were single income families and there was one adult that had time for food preparation. Today prepared foods and eating out are a necessity rather then a convenience for most couples.
Food has also gotten much cheaper relative to what it was in the 1970’s. Some would argue that it has also reduced in quality.
People in the 1970’s bought different things than people do today. In the 1970’s people bought more formal clothing (e.g. suits) and formal dinnerware than people today. They bought more wrist watch’s and slide rules.
But if you add up all the plusses and minuses the two income family today has less disposable income then the single income family in the 1970’s when you exclude the cost of transportation, healthcare, childcare and housing.
It turns out one of the biggest drivers of home prices is school quality and income potential. So two cars for two jobs in a place you can find them and housing and childcare to ensure that children are safe.
Houses are larger but most of the housing stock is much older than in the 1970’s. Most of the 1970’s housing stock is still around, it isn’t like we tore it all down in the last 10 years and built new, larger housing.
The starter homes of the US Boomer generation are out of reach of the Millennials even though they are the same houses but now 50 years old.
only the newer ones are much larger. the ones built in the 60s are still the same size they've always been. the point is # of hours worked to afford a house of a given set size is higher today than it was in the 70s. same is true for cars too and they haven't improved much: i know i'm cherry picking here but look at a corrola from today, the mpg is 35mpg, the same as it was 40 to 50 years ago. the new one is heavier than ever, loaded with safety features rarely used, nullifying most of the mpg tech increases.
Having your spouse not work is a sign of poverty. It means that if they worked, they wouldn't be able to bring in enough income to pay for childcare.
It is possible that you're just so rich their income wouldn't contribute to the family, but income is always useful - otherwise neither of you would be working.
That's actually more reasonable than what you'd get if you combine their inflation figures[1] with nominal GDP[2]. Eyeballing their inflation chart (actual figures are paywalled), it looks like we've been experiencing 9% inflation since 2000. Between Q1 2000 and Q1 2020, nominal GDP per capita went up 82% (ie. 1.822x), but 9% growth for 20 year works out to be 460% growth (ie. 5.604x). In other words, the economy contracted by 67% in real terms. Maybe they realized that's too ridiculous even for conspiracy theorists, and revised their figures accordingly?
Why would you link to GDP PER CAPITA? Are you ignoring that population has grown since 2000?
GDP since 2000 went from 10.5T to 24T (2.285x). Adjusted for 3% inflation, that's a 26% increase.
Your point remains.
4% inflation would mean a 4% increase over 20 years.
5% inflation would mean a 14% DECREASE over 20 years.
6% inflation would mean a 29% DECREASE over 20 years.
7% inflation would mean a 41% DECREASE over 20 years.
8% inflation would mean a 51% DECREASE over 20 years.
The problem is - the way people experience inflation is dramatically impacted by whether they had a 30-year fixed mortgage.
If your house PRICE went up 400% since 2000 and your housing cost went DOWN 20% since 2000 - inflation would obviously seem low.
If your rent went up 400% since 2000, it obviously feels different.
67% of people are homeowners - and the Fed's measure of inflation seems largely targeted to this group of people. The true rate of inflation is almost certainly higher - but probably nowhere close to ShadowStats.
> Why would you link to GDP PER CAPITA? Are you ignoring that population has grown since 2000?
1. using country level GDP gets you a 63% drop, hardly any better
2. The argument I was making was with respect to living standards (ie. there's no way that our income/living standards dropped 67% in 20 years). In that context it makes sense to use GDP per capita rather than GDP for the entire country. If US population grew 50% over some time period, and GDP only grew 25%, that's actually bad because that means the average person is actually worse off than before.
"continual decline" is an understatement of how big the decline supposedly is. I calculated the actual decline in my other comment[1]. In short, if their figures are to be believed, the US economy contracted 67% in real terms between 2000 and 2020. That would put US GDP per capita between Guyana and Argentina. Even if you believe the "US is in decline narrative", it's hard to believe that it's been declining to the level of Guyana or Argentina.
I don't know enough to debate the numbers, but if we're making external comparisons, my first question is whether the calculations for Argentina/Guyana have been altered to match the US shadowstat alterations.
That fixes the problem of "US declining to Argentina levels", but now you have a new problem: did the world economy contract by 67% between 2000 and 2020?
It's not, but the GDP figures I was looking up was in USD, so it should be factored in.
>but I think you're oversimplifying things.
Perhaps, but can you think of a plausible model for why our GDP would have dropped 67% in real terms, but somehow our living standards haven't dipped to that of a developing south american/african country? The only explanations I can come up with are:
1. the real GDP drop doesn't exist, or at least is vastly overstated
2. every other country (or at least the worldwide average) GDP dropped by approximately the same amount, so comparatively speaking we're still in the same place relative to other countries
Living standards aren't really that low in Argentina or Chile. They're obviously much higher in the US, but we also have 10x more public debt per Capita, and 5x more private debt per Capita.
Please re-read my comment. I'm not saying that GDP has actually been declining, I'm just saying that if we take nominal GDP and deflate using shadowstats' figures, the US economy would have been contracting. That's an absurd statement, which probably means the shadowstats' inflation figures are off.
> Adjusting for inflation using shadow stats, you'd still have lost money.
Major red flag -- shadow stats is a hyperinflation fantasy. Of course it looks like you'd lose money if you think inflation is orders of magnitude higher than it actually was.
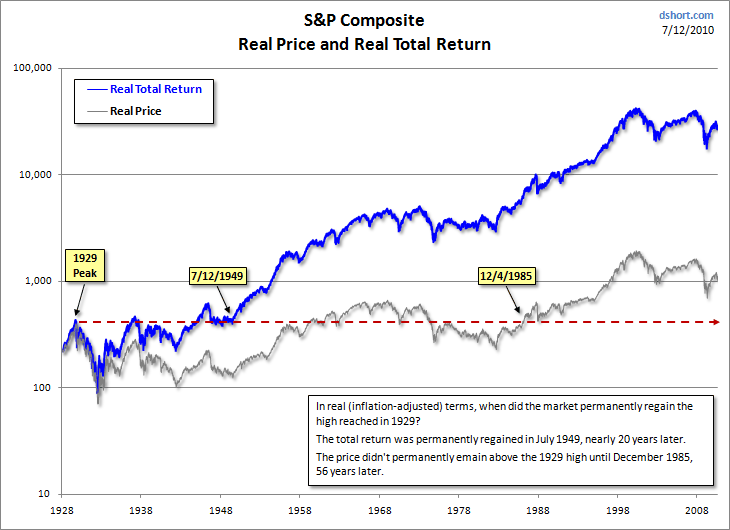
I remember vaguely a chart of total inflation-adjusted return, including dividends. Forgetting dividends leads some people to be much more pessimistic than they should.
The 1929 crash took just under 5 years to recover if adjusting for deflation and dividend yield (averaged 14% in that period). Nominal value took much longer but real value bounced back quick.
People who believe shadow stats don't know how exponential functions work. If you add 3% on top of an exponential function that new function will diverge exponentially from the original.
The evidence for shadow stats should be going up every year but we haven't seen that at all.
You can't just adjust for inflation like that because there's nowhere you can put your money and get inflation-rate returns. 1 dollar in 1920 is still 1 dollar now. The closest safe rate you can get is a savings account or CD but that is much lower than inflation.
I care about purchasing power over time. If inflation is going to mean that regardless of how I invest, tomorrow I will be able to buy less, then I would buy more today.
I know there are limits, like in 1920 I couldn't buy a 1gbps internet connection or a Moderna vaccine. But despite inflation's flaws, it is useful as part of a discount rate for measuring returns.
Goods don’t rise and fall in lockstep but standard figures aren’t bad.
In 1929 pig iron was 18.43$ per ton, it was $640-650 per tonne on March 7. Inflation calculator suggests it should be ~309$/ton which is fairly close across 92years but low. It also spiked to 1000+$/ton a few months later. https://www.usinflationcalculator.com/
Gasoline on the other hand was 0.21$/ gallon in 1929 plug into the inflation calculator and you get $3.53 much closer.
Chicken was 42¢/lb in 1929 New York same inflation number gives $7.06/pound today which is high.
What really messes things up is when goods stop representing the same thing across time. A new house in 1929 house was likely though not guaranteed to have indoor plumbing but AC was rare even though both where available back then. Of course 1929 AC was often focused on humility control not just temperature so again not apples to apples but in the other direction. Look for a comparable home base on floor space, number of bathrooms etc and housing prices are rising much slower than many charts suggest.
We all know that efficiencies have driven down the cost of many manufactured goods (like TVs) and scalable services (like ATMs and online banking)
We also all know that cost disease has driven up non-scalable services (healthcare, higher Ed, govt) and supply-constrained good/assets (price of land)
The basket is still useful for understanding whether an investment clears your hurdle :)
I am not convinced things break down that simply. Healthcare is probably the best example of something that isn’t compared Apples to Apples across time. The cost of an X-Ray, cast, and some pain killers isn’t seeing nearly the cost increase those charts suggest.
Adjusting for inflation using shadow stats, you'd still have lost money.
With the Florida land bubble - you're also forgetting property taxes.